Prices move in trends, and these trends tend to continue in the same direction for extended periods of time. The technical analyst, through the use of charts and other indicators, attempts to identify these trends. The charts do not cause the market to go up or down. They simply reflect the market's perception of the fundamentals. In essence, it is a matter of cause and effect. Fundamental analysis seeks to interpret cause, while technical analysis interprets effect. The fact that XYZ's earnings continue to grow is the fundamental cause for higher stock prices while the actual price range in which XYZ finds support and resistance is the effect.
When we look at a chart, even a novice can see that markets fluctuate up
and down in a succession of peaks and troughs. If the peaks are getting higher
and higher, the trend is said to be up. Conversely, if the troughs are getting
lower and lower, the trend is down. Sometimes, both of these trends are evident
at the same time. This is a mixed trend and indicates a market trying to decide
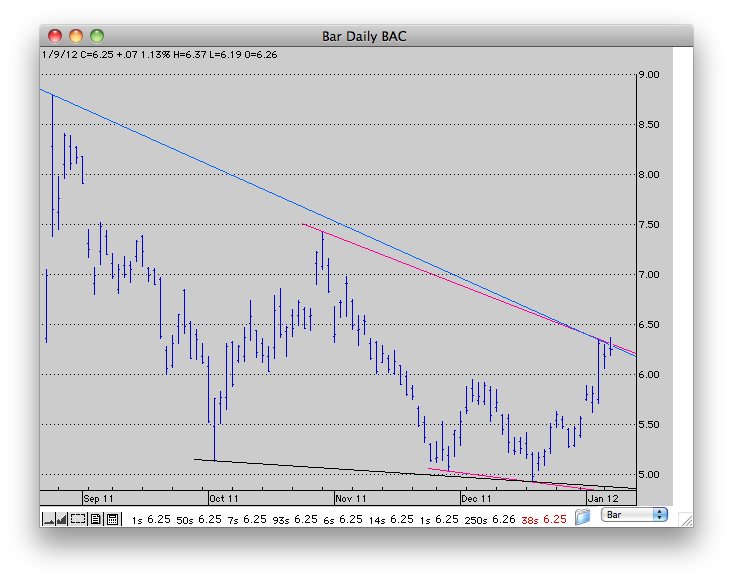
whether to continue the previous trend or establish a new one. A line can
be drawn between successive peaks or troughs to graphically illustrate the
trend. It takes two points to define a trend and a third to confirm. The top
line is termed the line of resistance and the line connecting the troughs
is termed the support line. Trends are most often broken down into three categories
-- primary, secondary, and minor. Identifying the trend and the magnitude
of the trend are the key to chart analysis. One of the oldest sayings on Wall Street is "the trend is your friend."
Automatic Trend Lines created using Pro Analyst from Trendsetter Software.