All of Trendsetter Software's Macintosh products include Gerald Appel's MACD, an oscillator based on exponential moving averages of closing prices. Exponential moving averages assign greater weight to the most recent price data so they are more sensitive than simple moving averages. The standard formula, as defined by Appel, subtracts the difference between a long term (26 period) and a short term (12 period) exponential moving average. This difference is then made into another moving average (9 period) before display. The moving average of the difference is known as the Signal Line. When the fast MACD line crosses above the signal line, it gives a buy signal. Conversely, when the fast line crosses below the signal line it is time to sell. As with all oscillators, look for divergence from price pattern and trend within the oscillator as well.
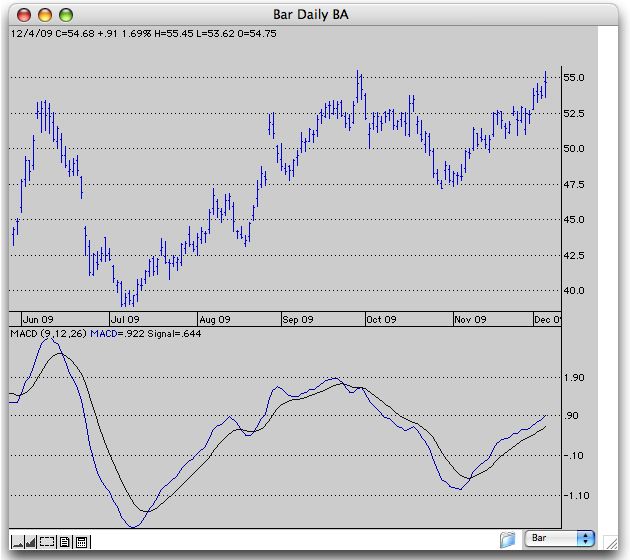
Daily bar chart of Boeing with
standard MACD double line display.
Chart created using Pro Analyst from Trendsetter Software.
MACD is also available in histogram form. Each bar in the histogram measures the difference between the fast MACD line and the Signal line. It crosses zero when the double lines are crossing each other. A cross above zero into positive territory represents a buy signal, and a cross into negative territory indicates a sell signal.
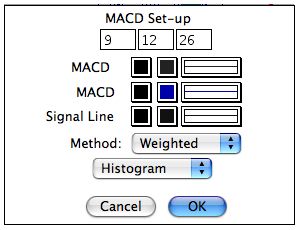
Our MACD preferences allow you to define the period of each moving averaged used to calculate MACD, determine the type of moving average (i.e., exponential, simple or weighted), its color and line thickness and whether we display the standard double line or the histogram version.