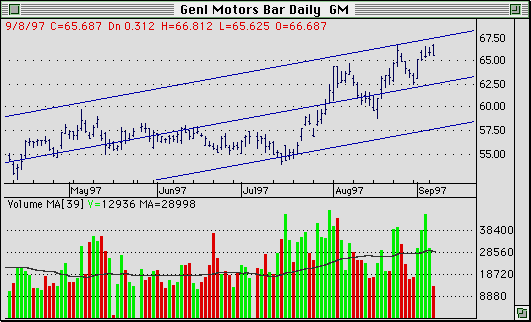
 Daily bar chart of General Motors with linear regression lines and color
coded volume bars.
 Chart created using Personal Hotline from Trendsetter Software
Linear regression is one of the accepted standards for identifying major trends. This statistical model, based on volatility, produces a center line, or equilibrium price, around which prices will fluctuate; and buy and sell lines that define the range of projected price fluctuation. In theory, 90% of all prices will fall between the buy and sell lines. Long term investors can buy with a minimum of risk when the price approaches the buy line and sell with maximum reward at the sell line.
 Daily bar chart of General Motors with linear regression lines and color
coded volume bars.
Chart created using Personal Hotline from Trendsetter Software
Personal Hotline uses this tool to calculate the “Regression rating” component of its automated modeling system . The rating reflects the relationship of current prices to the center line (median). As we move towards the lower line (oversold) the rating will approach 100. As we move towards the upper line (overbought) the rating will approach -100. As prices can exceed the outer line boundaries, the ratings can exceed ± 100. This rating can then be used for ranking and/or screening.
Next Page Japanese Candle Stick Charts
Technical Analysis Table
of Contents
Back to Trendsetter Software Products
and Services